
14Nov
Ocean Carbon Observing Networks: Why Coordinating Ships and Floats Matters Now
Quick answer: Ocean carbon observing networks are coordinated sets of ship-based and profiling float measurements that track carbon in seawater. A 2026 Earth's Future study argues that designing the three major networks to work together would improve estimates of ocean carbon uptake, which is about 25 to 30 percent of global carbon dioxide emissions.
Key Takeaways
- The ocean absorbs about 25 to 30 percent of global carbon dioxide emissions, but that uptake varies in space and time.
- Three major global networks measure ocean carbon using ship-based and profiling float methods.
- The networks differ in coverage, sampling frequency, measurement specifications and maturity, which creates room for co-design.
- Sutton and colleagues argue that maximizing network synergies would improve estimates of natural and human-caused ocean carbon fluxes from seasonal to decadal timescales.
- With financial pressure rising on ocean observations, optimizing existing networks is described as critical to sustaining their value.
Why do ocean carbon observations matter?
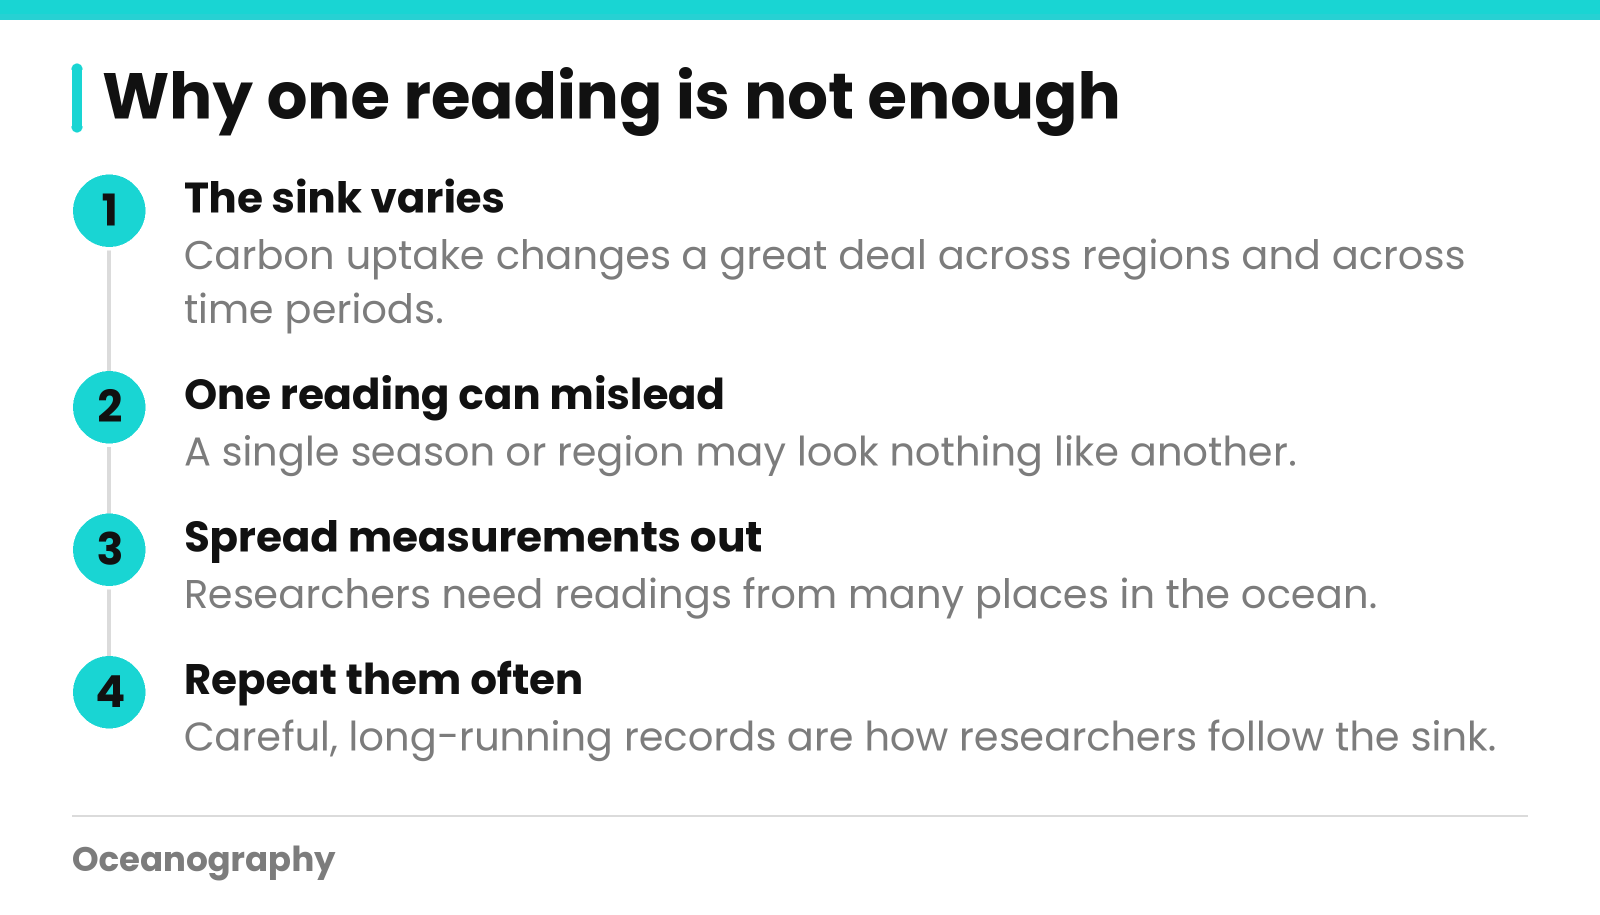
Seawater soaks up between 25 and 30 percent of the carbon dioxide that people emit worldwide. That share shifts from one region to the next and from one period to another. Scientists also cannot say for sure how it will change. Measurements that run for many years, and are made with care, are how researchers follow it.
This post draws on an Eos Editors' Highlight about a 2026 paper in Earth's Future. Here we cover what the study is about, what its key terms mean, and where on our site you can explore related ocean science.
What is an ocean carbon sink?
A carbon sink takes in more carbon than it releases. The ocean fits that description because surface water pulls carbon dioxide out of the air. When we talk about the ocean carbon sink, we mean the full amount of carbon the sea absorbs during a chosen stretch of time.
Why does variability make measuring hard?
Uniform uptake would mean a handful of instruments could do the job. Reality is messier. The source says the sink changes a great deal across both place and time. One reading from a single season or region may look nothing like a reading from somewhere else.
So researchers need plenty of measurements. They need them spread out and repeated often.
What do reliable estimates support?
The source points to two uses. Good estimates of the sink help constrain remaining carbon budgets. That phrase refers to how much carbon dioxide can still be emitted while staying within a given climate goal. They also show how carbon uptake by the ocean affects marine ecosystems.
Curious about life in the sea? Our Biological Oceanography page is a good starting point.
How do ocean carbon observing networks work together?
Ships and profiling floats are the tools behind three major global networks that measure ocean carbon. The networks vary in where and how often they sample, in their measurement specifications, and in how mature they are. Because of those differences, one network can cover what another misses. Researchers therefore want the networks planned as one team, not as separate projects.
The three networks in the study figure
The figure with the Eos item shows an optimized layout of three networks, labeled GO-SHIP, SOCONET and BGC-Argo. The source describes them like this.
| Network | What the source tells us |
|---|---|
| GO-SHIP | Shown as ship-based measurements |
| BGC-Argo | Shown as profiling float measurements |
| SOCONET | Shown as the third network in the figure; the full paper has the details |
As a group, the networks cover the surface ocean and the water below it. The source uses the term depth-resolved for the second kind. It simply means each reading is linked to a particular depth.
What is a profiling float?
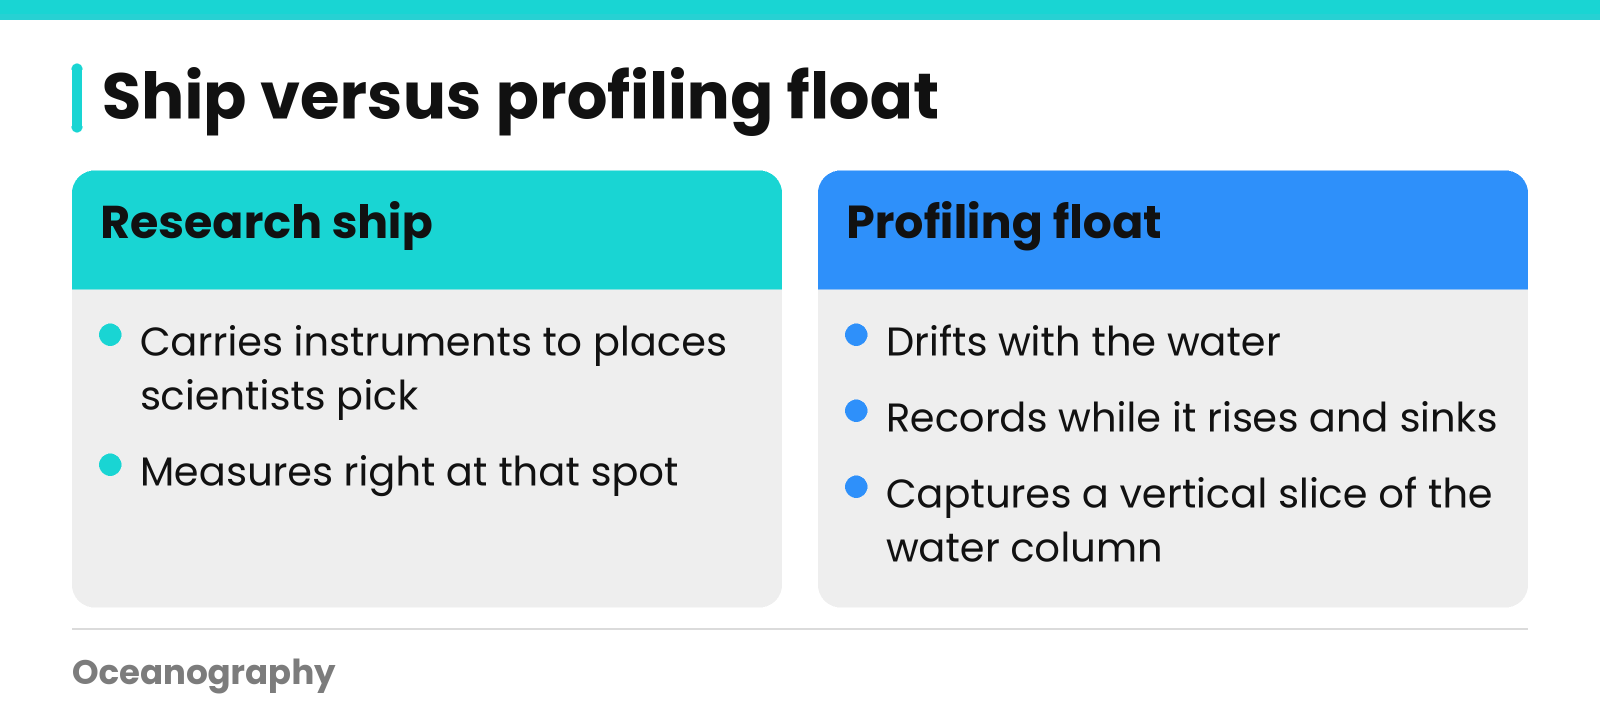
A profiling float drifts with the water and records its properties while it rises and sinks. Every trip captures a vertical slice of the water column. A ship works differently. It carries instruments to places that scientists pick, and it measures right there.
Neither approach is better. Each shows the ocean from a different angle.
Four ways the networks differ
The source names the differences that open the door to co-design:
- Coverage: how much of the ocean is sampled, and when.
- Sampling frequency: how often measurements are repeated.
- Measurement specifications: the standards each network follows.
- Maturity: how established each network is.
Picture weather stations and satellites. Alone, each leaves holes. Planned together, they reach further. The same logic applies to these networks, though the paper holds the specifics.
What does the new study say about co-designing networks?
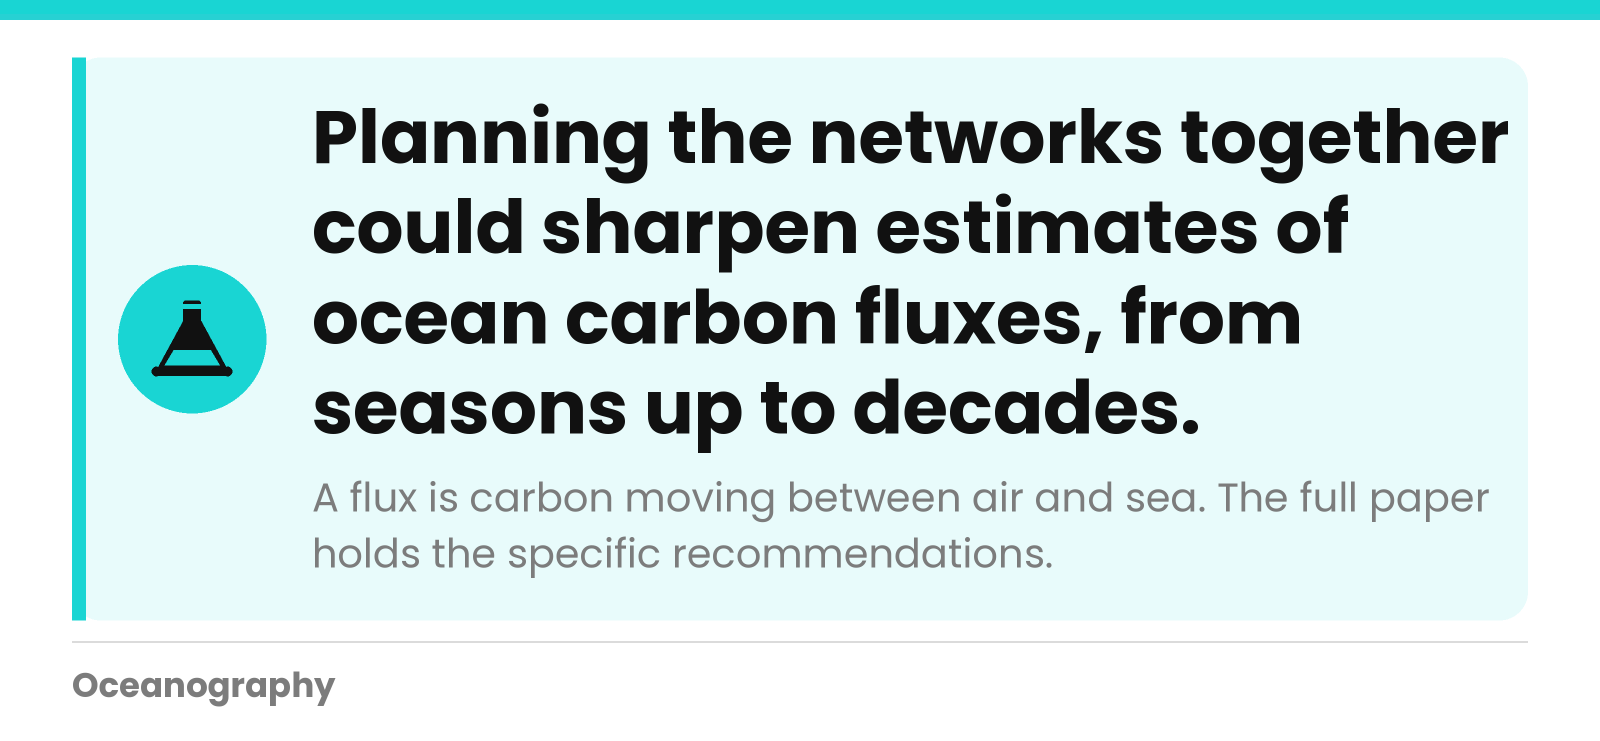
Sutton and colleagues published in Earth's Future in 2026. They assess how a multi-network program could be co-designed. Their argument is that using the strengths the networks share would sharpen estimates of natural and human-caused ocean carbon fluxes, from seasons up to decades. It would also help narrow down climate feedbacks on the sink.
What do fluxes and feedbacks mean?
A flux is the amount of something that moves from one place to another. In this case it is carbon traveling between air and sea. Natural fluxes occur without any human influence. Anthropogenic fluxes are tied to human activity, meaning our emissions.
A climate feedback is a change that either speeds up or slows down another change. The study hopes to help scientists see how these feedbacks act on the ocean carbon sink.
What we can and cannot say
The Eos item is a brief summary by a journal editor. It says the authors give actionable recommendations, yet it never lists them. We will not guess. For the actual proposals, read the full paper: Sutton et al. (2026), Earth's Future, 14, e2026EF008722, doi.org/10.1029/2026EF008722.
Why does optimizing existing networks matter now?
Money for ocean observations is getting tighter. The editor summary says that improving how current networks fit together is critical to sustaining the scientific and societal value they provide. Put simply, smart coordination is one way to protect the measurements that climate research depends on when budgets shrink.
Long records need steady support
Questions about seasons and decades call for data gathered over many years. If measurements stop today, the record may carry a hole that no one can fill later. Researchers care about sustained observation for this reason.
A quick checklist for reading ocean carbon research
Next time you open a paper or news item on this topic, keep these questions in mind:
- Which measurement method is used: ships, floats, or both?
- What region and time span does the data cover?
- Is the result about natural carbon movement, human-caused change, or both?
- Does the summary state what is uncertain?
Strong science writing admits its limits. The source does so too, noting that how the sink will change is still uncertain.
How Oceanography helps you follow ocean carbon science
Oceanography.com is based in Franklin, Massachusetts. We bring together live and historical ocean datasets, a worldwide index of research documents, and a repository of peer-reviewed articles. Search data by region, read the research, and find teaching resources, all in one place. That makes it simpler to see how ocean observations link to published science.
Explore the data
Our live ocean measurements are collated from some of the largest oceanographic institutions in the world. With the map tool, you can search real-time datasets by region and see results as tables or graphs. Downloads are available too. Before you plan a project, check which measurements exist for your area of interest. To begin, search datasets.
Read the research
Our articles index and repository leads you to oceanographic research documents on every aspect of ocean science and its applications. Peer-reviewed articles in our own repository go online immediately after publication, and members can search them for free.
Teach and learn
Classroom materials are waiting in our teacher resources. Students curious about how water travels around the planet can read about global circulation. Knowing how currents work helps before you take on questions about carbon.
Ready to look at real ocean measurements? Search Datasets or call us at +1 (877) 805-3282.
Frequently Asked Questions
How much carbon dioxide does the ocean absorb?
The ocean absorbs about 25 to 30 percent of global carbon dioxide emissions, according to the summary of a 2026 Earth's Future study. That share is not fixed. It varies across regions and over time, and scientists remain uncertain about how the ocean carbon sink will change in the future.
What is an ocean carbon observing network?
An ocean carbon observing network is a coordinated set of measurements that track carbon in seawater. The three major global networks discussed in the study use ship-based and profiling float methods to measure the surface ocean and the water column at different depths. Together they help scientists estimate how much carbon the ocean takes up.
What are GO-SHIP, SOCONET and BGC-Argo?
They are the three networks shown in the study's figure of optimized ocean carbon observing. GO-SHIP is ship-based, and BGC-Argo uses profiling floats. SOCONET is the third network shown. The study treats them as complementary, so the full paper is the best place to read how each one contributes.
What is a profiling float?
A profiling float is an instrument that drifts in the ocean and measures water properties at different depths as it moves up and down. BGC-Argo is the float network named in the study. Floats add depth-resolved measurements to the picture alongside ship-based work.
Why does funding matter for ocean carbon observations?
Financial pressure on oceanographic observations is increasing, and the study's editor summary calls optimization of existing networks critical. Sustaining measurements keeps the scientific and societal value they provide. Coordinating networks is one way to get more from what is already in place.
Where can I find ocean data and research?
You can search real-time and historical ocean datasets by region on Oceanography.com, with tabular or graphical results and downloads. The site also hosts a worldwide index of research documents and a repository of peer-reviewed articles. Check the datasets for the specific measurements you need, since coverage varies by region.
