
14Nov
Midlatitude Ocean Warming Is Stronger in Late Summer: What a New Study Explains
Quick answer: Midlatitude oceans warm faster in late summer because the stirred surface layer is thinner then, so it holds less heat capacity, and its heat exchange with the air pushes back less. A new study found late-summer warming about 75% faster than late-winter warming in both observations and climate models.
Key Takeaways
- A new study reports that midlatitude oceans warm about 75% faster in late summer than in late winter, in both observed records and climate models.
- In the study's model, a thinner summer mixed layer and weaker surface heat flux feedback drive the stronger summer response.
- A shallower mixed layer can add to the seasonal difference without changing the average warming.
- Mixing of water into the surface layer in fall helps set the timing of the late-summer peak.
- Seasonal differences mean the month you choose can change what an ocean temperature trend looks like.
Why is the midlatitude ocean warming faster in summer?
Midlatitude oceans warm faster in late summer mainly because the sun-warmed surface layer is thin then, so the same extra heat raises its temperature more. Surface heat exchange with the air also pushes back less in summer. A new study found late-summer warming about 75% faster than late-winter warming.
The midlatitudes are the broad bands between the tropics and the polar regions. Think of the North Atlantic off New England or the North Pacific off Japan. These waters have strong seasons, and a research team has now shown that climate warming has seasons too.
What the 75% figure means
The authors, based at the University of Wisconsin-Madison and the University of Colorado Boulder along with other institutions, looked at sea surface temperature (SST), which is the temperature of the ocean's upper skin. They report that SST records and global climate model runs both show midlatitude oceans warming 75% faster in late summer than in late winter. You can read the full paper in npj Climate and Atmospheric Science.
This is a comparison of trends, not of temperatures. A late-summer ocean is still warmer than a late-winter ocean. The point is that the amount of change over the years is larger in late summer.
Observations and models agree
The team did not rely on one tool. They compared observed records with a suite of climate model simulations, then built a simpler model of the ocean's surface layer to test the cause. The observed data came from the NOAA Physical Sciences Laboratory, and the climate models came from CMIP6, a coordinated set of model experiments.
Because the pattern shows up across many models, the authors describe it as a basic property of the climate system. That is a strong statement, so keep in mind that this version of the paper was shared early and may be edited before the final version.
What is the ocean mixed layer and why does it matter?
The mixed layer is the top part of the ocean where wind and waves stir the water so its temperature stays fairly even. Its depth changes with the seasons. Because a shallower layer can store less heat per degree of warming, it responds more strongly in summer.
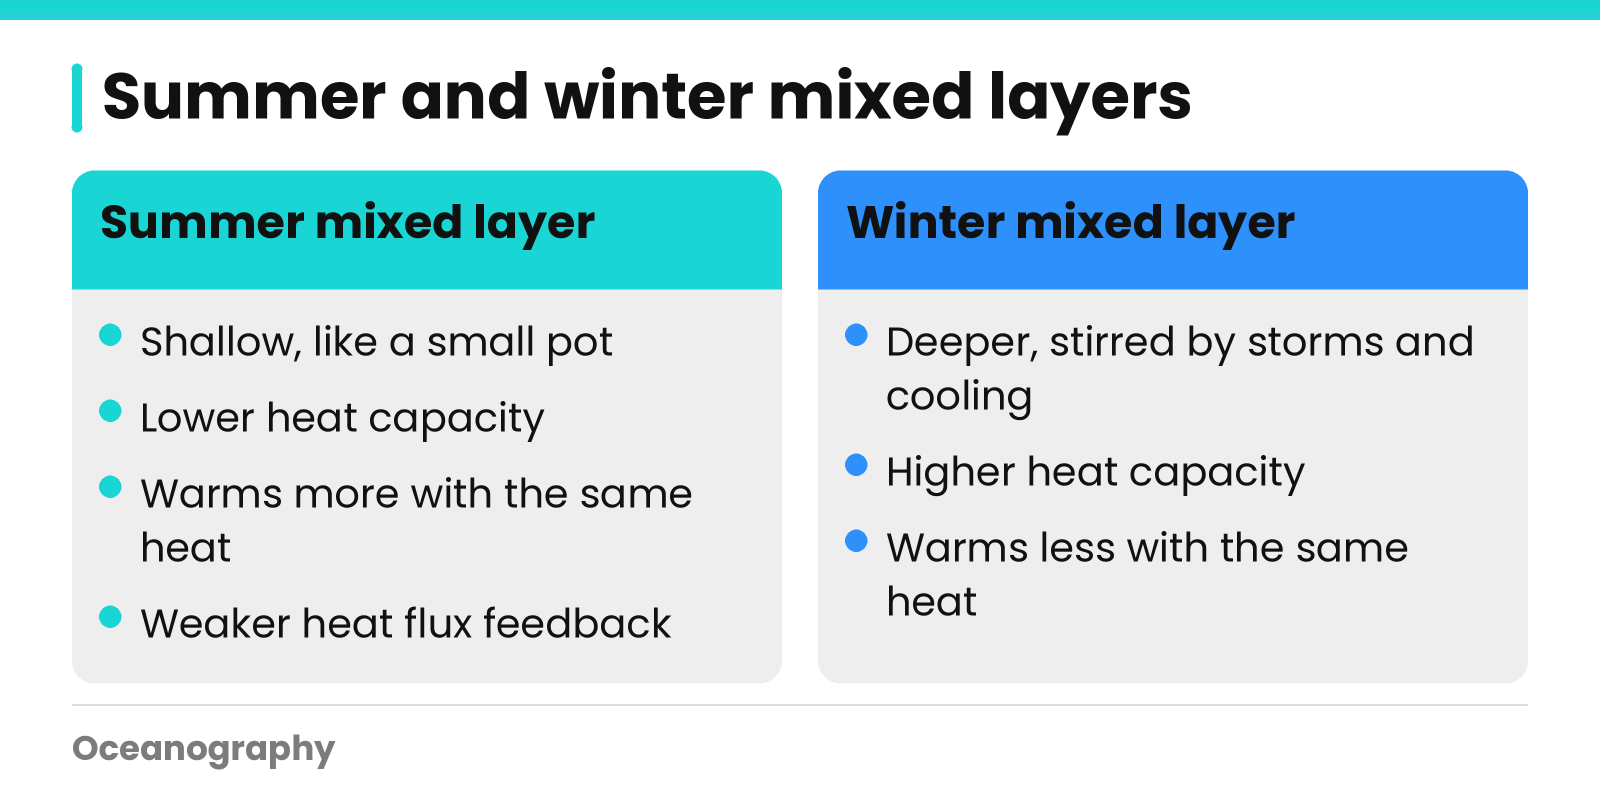
Picture two pots on a stove. A shallow pot of water heats quickly, while a deep pot takes much longer with the same flame. The summer mixed layer is the shallow pot. The winter mixed layer, stirred deeper by storms and cooling, is the deep one.
A thinner layer has less heat capacity
Heat capacity is how much heat a body of water must absorb to warm by one degree. In the study's mixed layer model, lower summer heat capacity was one of two main reasons for the stronger summer response. This held even when the outside push on the climate was kept constant.
That outside push is called forcing. Rising greenhouse gases are one example. The key result is that a steady push can still produce an uneven seasonal response, because the ocean itself changes through the year.
Weaker surface heat flux feedback in summer
Surface heat flux is the movement of heat between the ocean and the air. A feedback is how that movement changes as the surface warms. The study found that this feedback is suppressed in summer, which we can read as the ocean being less able to shed the extra heat then.
Put the two effects together and you get a larger late-summer warming trend. The table below sums up the pieces tested in the study.
| Factor | Plain-language meaning | Role in the study's model |
|---|---|---|
| Summer heat capacity | How much heat the thin surface layer can hold per degree | Lower in summer, which boosts the warming response |
| Surface heat flux feedback | How heat exchange with the air changes as the surface warms | Suppressed in summer, which boosts the response |
| Shoaling mixed layer | The surface layer becoming shallower over time | Adds to the summer response without changing the mean response |
| Fall entrainment | Water from below mixing into the surface layer | Helps set when the late-summer peak occurs |
Why does the warming peak in late summer instead of midsummer?
In the study's model, a process called entrainment helps set the timing. Entrainment is the mixing of cooler water from below into the surface layer as it deepens in fall. Together with the thin summer layer, it shapes why the strongest warming trend appears in late summer.
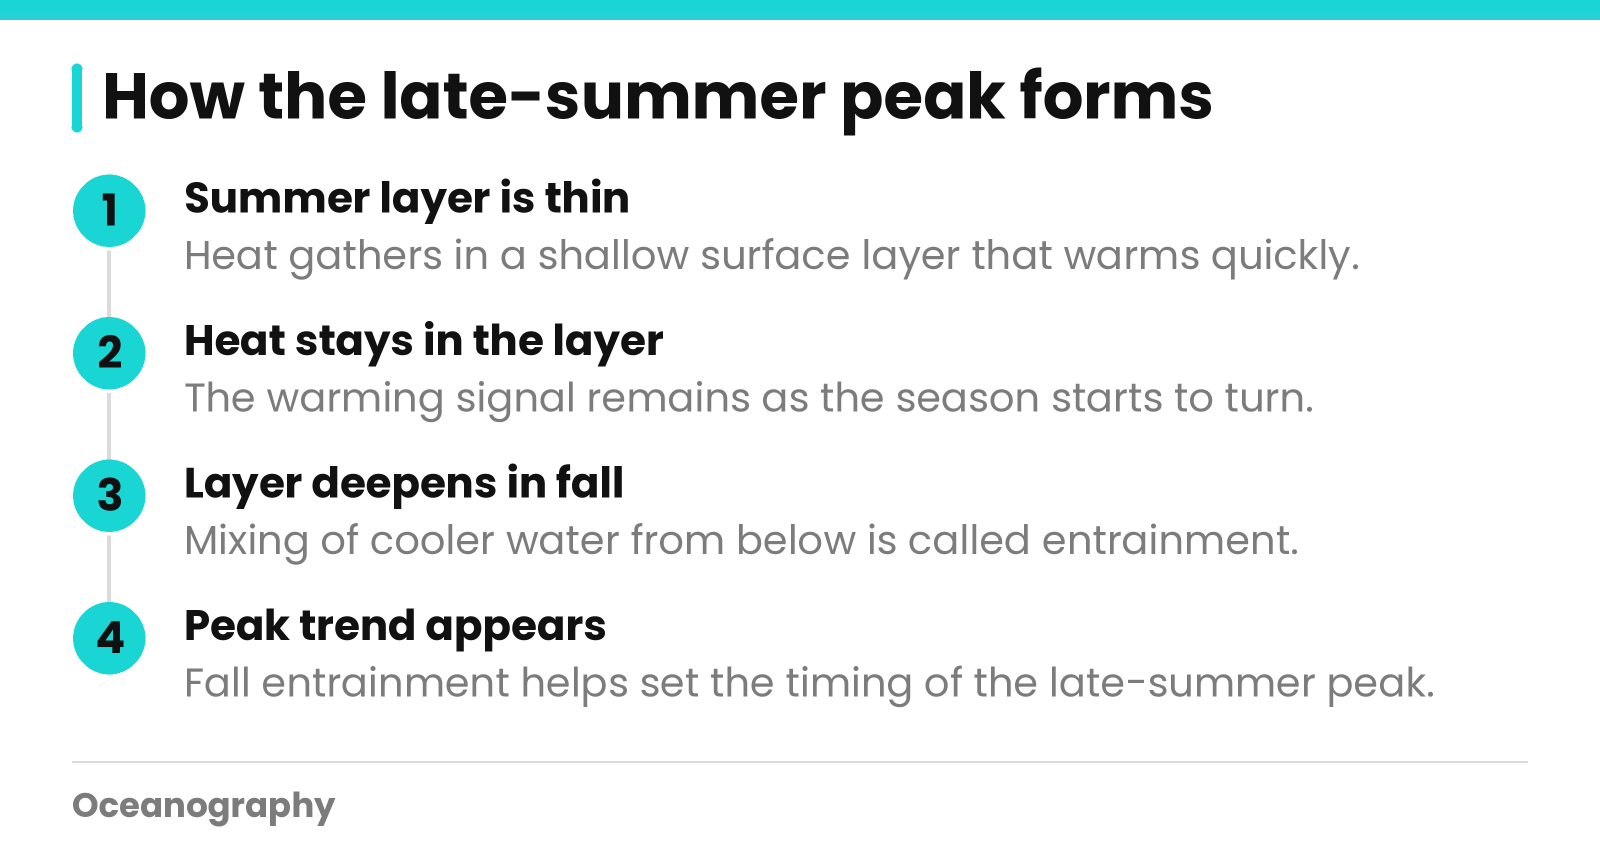
This explains the delay. The surface layer is thinnest in summer, but the full effect shows up a bit later, as the season turns and the layer starts to deepen again.
Fall mixing and the timing of the peak
The authors found that fall entrainment contributed to the timing of the peak in both of their experiments. It acts like a clock. Heat gathered in the thin summer layer is still there when the layer begins to deepen, and the mixing shapes when that signal is strongest.
A shallower layer over time
Climate models suggest the mixed layer itself may become shallower as the ocean warms. This is called shoaling. The team ran a second experiment to test whether shoaling could feed back on the seasonal pattern.
It did. A shoaled mixed layer produced an enhanced summer response without changing the mean, or yearly average, response. When the researchers combined a non-seasonal forcing with a shoaling layer, the result matched the seasonality seen in the model trends, even without any seasonal forcing at all.
This does not mean other factors never matter in the real ocean. It means a fairly simple mechanism can explain much of the pattern, which gives scientists a clear starting point for interpreting, attributing and projecting ocean change.
What does this mean when you read ocean data?
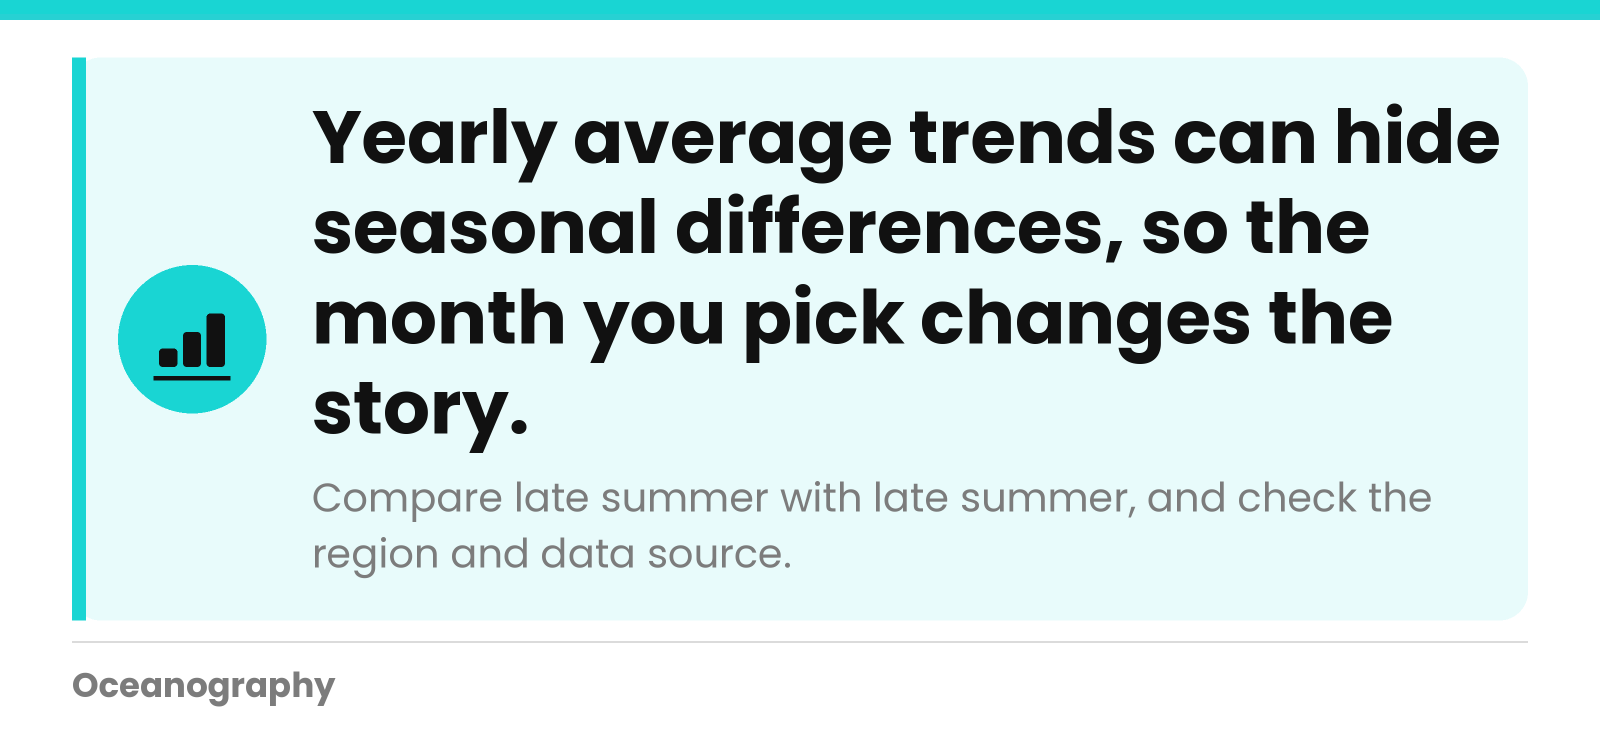
It means yearly average trends can hide seasonal differences. In the midlatitudes, late-summer trends can run well ahead of late-winter trends, so the month you pick changes the story. When you compare sea surface temperature records, check the season and the data source.
Here is a short checklist for students, teachers and researchers who work with temperature records.
- Name the season. Compare late summer with late summer, not with an annual average.
- Check the region. The study focuses on midlatitude oceans, so do not assume the same pattern in the tropics or near the poles.
- Note the source. Observed records and model output answer different questions.
- Look at the layer. Surface temperature is not the same as temperature at depth.
- Keep claims modest. One study, even a well-supported one, is a piece of the picture.
For a classroom, try this question: if the surface layer is thinner in summer, what should happen to its temperature on a hot, calm day? Students can then test the idea against real measurements. Our Global Circulation explainer is a good companion read, since surface heat is moved around the planet by currents.
How Oceanography helps you explore seasonal ocean change
Oceanography.com, based in Franklin, Massachusetts, offers live and historical ocean datasets by region, a worldwide index of research documents and a repository of peer-reviewed articles. You can search measurements for an area, view results as tables or graphs, and download them for your own analysis.
Our live measurements are collated from some of the largest oceanographic institutions around the world. Use the map tool to pick a region and look at how conditions change through the year. You can search datasets to see seasonal patterns for yourself.
If you want to read the research behind a topic like this, browse our articles index and repository. Peer-reviewed articles are posted online immediately after publication, and they are free for members to search. Educators can find classroom material in our teacher resources.
Questions about getting started? Call us at +1 (877) 805-3282.
Frequently Asked Questions
How much faster does the midlatitude ocean warm in late summer?
A new study reports that midlatitude oceans warm about 75% faster in late summer than in late winter. This appears in both observed sea surface temperature records and global climate model simulations. The figure compares warming trends between seasons, not the actual temperatures of those seasons.
What is the ocean mixed layer?
The mixed layer is the upper part of the ocean where wind and waves stir the water, keeping its temperature fairly uniform. Its depth changes through the year. It is thin in summer and deeper in winter, which affects how strongly the surface responds to added heat.
Why does a thinner mixed layer warm faster?
A thinner mixed layer has less heat capacity, meaning it takes less heat to raise its temperature by one degree. In the study's model, this lower summer heat capacity was one of the two main drivers of the stronger summer warming response, along with weaker surface heat flux feedback.
What is entrainment in the ocean?
Entrainment is the mixing of water from below into the surface mixed layer, which happens as the layer deepens. In this study, mixing in fall helped determine the timing of the late-summer warming peak. It affects when the strongest trend shows up, not just how large it is.
Is this result based on observations or models?
It uses both. The authors checked observed sea surface temperature records and a suite of global climate model simulations, then tested the cause with a simpler seasonal mixed layer model. The paper was shared early as accepted research, so details may change in the final version.
Where can I find ocean temperature data to explore seasons myself?
You can use the map tool on Oceanography.com to search real-time and historical ocean datasets by region. Results can be viewed as tables or graphs and downloaded. Live measurements come from some of the largest oceanographic institutions around the world.
