
28May
The Role of Oceanographic Data in Oil Spill Detection and Response
An oil spill can move fast. It can spread across open water, break into smaller patches, and reach a shoreline before response teams fully understand the damage.
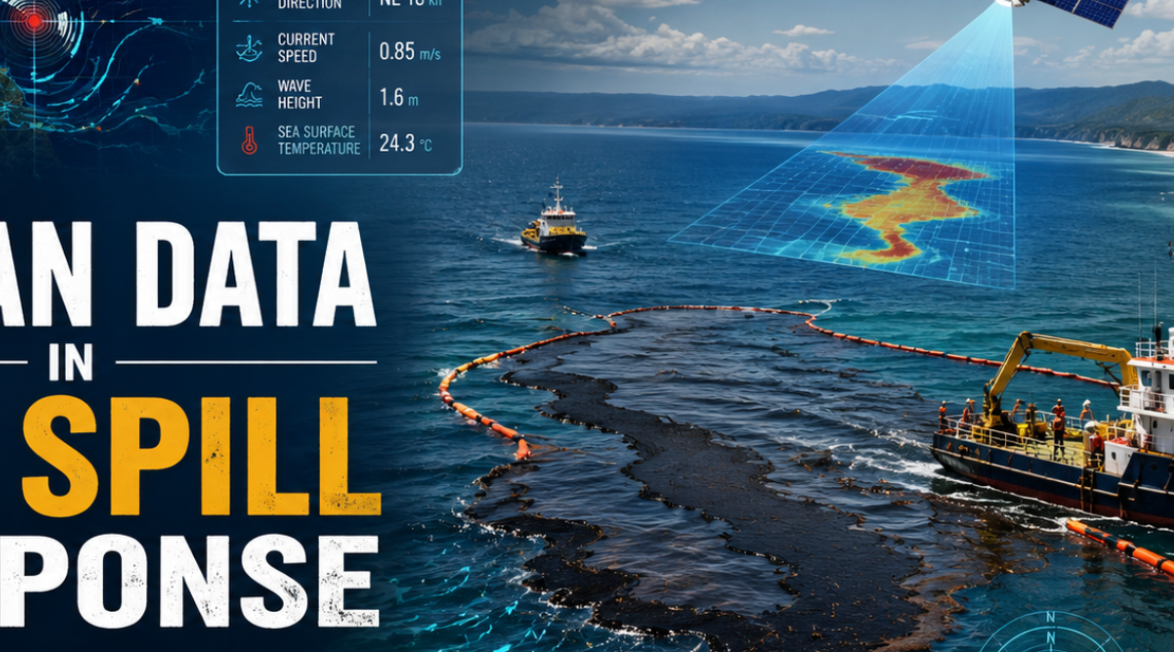
That is why oceanographic data in oil spill response is so important. It helps teams see where the oil is, understand how it is moving, and decide which areas need protection first.
This article explains how oceanographic data supports oil spill detection, tracking, cleanup planning, and long-term coastal protection.
Why Oceanographic Data in Oil Spill Response Matters
Oil spill response depends on timing and accuracy. A small delay can allow oil to reach beaches, fishing areas, coral reefs, wetlands, or ports.
Oceanographic data gives response teams the information they need to act with confidence. This includes data on ocean currents, wind direction, wave height, tides, water temperature, and shoreline conditions.
Without this information, cleanup crews may be sent to the wrong location. With accurate data, teams can place barriers, send vessels, protect sensitive areas, and update the response plan as conditions change.
How Ocean Spills Are Detected
Satellite Monitoring
Satellites are useful because they can scan large ocean areas quickly. This is especially important when a spill happens far from shore or in rough weather.
Synthetic Aperture Radar, known as SAR, is often used for oil spill detection. Oil can make the sea surface appear smoother than nearby water, and SAR imagery can help identify those changes. NASA explains that SAR can support oil spill monitoring by helping detect slick location, size, and movement patterns.
Satellite data is not perfect on its own. Calm water, algae, or other natural substances can sometimes look like oil. That is why responders usually compare satellite results with aircraft images, field reports, and ocean condition data.
Aircraft, Drones, and Field Teams
Aircraft and drones help confirm what satellites detect. They provide closer images of the oil slick and help teams check whether the spill is moving toward coastal areas.
Drones are also useful in unsafe or hard-to-reach places. They can monitor shoreline impact, check cleanup progress, and reduce the need to send people into risky areas.
Field teams still play a major role. They collect samples, report oil thickness, and check conditions directly from boats or shorelines.
How Oceanographic Data Tracks Oil Movement
Finding the oil is only the first step. Response teams also need to know where it may move in the next few hours or days.
Oil movement depends on many natural forces. Ocean currents carry it across the water. Wind pushes the surface slick. Waves break it into smaller sections. Tides can pull oil into bays, rivers, wetlands, and harbours.
Water temperature also matters because it affects how oil changes over time. Some parts may evaporate, while heavier parts may stay in the water or move toward the shoreline.
This is where spill trajectory modelling becomes valuable. NOAA’s GNOME tool uses wind, current, oil type, and water turbulence data to predict the movement of spilled oil.
These models do not remove uncertainty, but they give responders a practical forecast. That forecast helps teams decide where to send vessels, where to place containment booms, and which coastal areas may need urgent protection.
How Data Improves Cleanup Decisions
It Helps Protect Sensitive Areas First
Every coastline is different. A sandy beach, fishing harbour, mangrove forest, and coral reef will not face the same level of damage from an oil spill.
Oceanographic data helps identify the areas most likely to be affected. This allows response teams to protect sensitive habitats before the oil arrives.
For example, if current and wind data show that oil may move toward a wetland, teams can place protective barriers early. If the oil is moving offshore, vessels and skimmers may be sent before the spill spreads further.
It Helps Choose the Right Cleanup Method
Different spills need different cleanup methods. A thick oil slick in calm water may be handled differently from scattered oil patches in rough seas.
Data helps teams choose between containment, skimming, shoreline cleanup, wildlife protection, or other response actions.
Good data also helps prevent wasted effort. Cleanup crews can focus on the places where their work will make the biggest difference.
It Keeps Response Teams Coordinated
Oil spill response often involves government agencies, coast guards, scientists, port authorities, vessel operators, cleanup contractors, and local communities.
If each group works from different information, confusion grows. Shared oceanographic data gives everyone a common view of the spill.
That common view helps teams make faster decisions and avoid duplicated work.
The Role of Ocean Research Before a Spill Happens
Oil spill response should not begin after the accident. The best response plans are built earlier through mapping, monitoring, and local ocean studies.
Long-term ocean research helps experts understand how currents, tides, habitats, and seasonal weather patterns behave in a specific area. This becomes extremely useful when an oil spill occurs.
If response teams already understand local ocean behaviour, they can act faster. They can also prepare risk maps, run emergency drills, and identify which coastal areas need the most protection.
Conclusion
Oceanographic data in oil spill response gives teams the facts they need when time matters most.
It helps detect oil faster, forecast spill movement, protect sensitive coastlines, and guide cleanup crews toward the right areas. Oil spills are difficult to control, but strong ocean data makes the response more accurate and less chaotic.
Explore more ocean research at Oceanography
FAQs
1. What is oceanographic data in oil spill response?
Ans: Oceanographic data in oil spill response means using information about currents, wind, waves, tides, temperature, and shoreline conditions to detect, track, and manage oil spills.
2. How do satellites help detect oil spills?
Ans: Satellites help detect possible oil slicks by identifying unusual changes on the sea surface. SAR imagery is especially useful because it can collect data at night and through clouds.
3. Why are ocean currents important during an oil spill?
Ans: Ocean currents can carry oil away from the spill site and toward sensitive coastal areas. Current data helps responders estimate where the oil may move next.
4. What is oil spill trajectory modelling?
Ans: Oil spill trajectory modelling predicts the likely path of spilled oil over time. NOAA’s GNOME oil spill modelling tool is one example used for spill planning and response.
5. Can oceanographic data protect marine life?
Ans: Yes. It helps teams identify habitats, breeding grounds, fisheries, and coastal ecosystems that may be at risk from oil exposure.
6. What information is needed right after an oil spill?
Ans: Response teams need the spill location, oil type, wind direction, current speed, wave height, tide stage, weather conditions, and nearby sensitive areas.
7. Are drones useful in oil spill response?
Ans: Yes. Drones can capture close images, monitor shorelines, and inspect dangerous or difficult areas without putting crews at unnecessary risk.
8. How does weather affect oil spill response?
Ans: Weather affects how oil spreads, breaks apart, evaporates, or moves toward shore. Strong wind and rough waves can make cleanup slower and more difficult.
9. Can oil spills be prevented with ocean data?
Ans: Ocean data cannot prevent every accident, but it helps identify high-risk areas near shipping routes, offshore platforms, ports, and pipelines. This supports better planning and faster emergency response.
10. Why is real-time data important during a spill?
Ans: Real-time data helps teams adjust as the spill moves. NASA’s SAR oil spill detection resources show how satellite data can support timely oil slick monitoring.
